
According to a new study by the Global Carbon Project (GCP) titled, “Global Nitrous Oxide Budget (1980-2020)”, the emissions of nitrous oxide have been rising continuously between 1980 and 2020.A study found that in 2021 and 2022, nitrous oxide was released into the air faster than ever before, even though we need to cut greenhouse gasses to fight global warming.
GCP Study
- Global Carbon Project (GCP) is an organisation established in 2001 which conducts studies that seek to quantify global greenhouse gas emissions and their causes.
- This study by GCP analyses the impact of human activity on greenhouse gas emissions and earth systems and quantifies emissions of carbon dioxide, methane and nitrous oxide (3 major greenhouse gases) to inform public policy and international action.
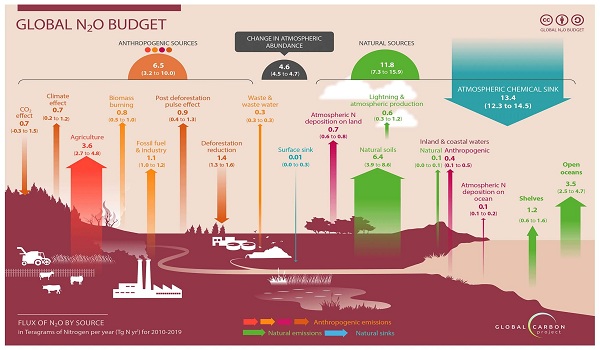
- It involved the examination of global data for all major economic activities that lead to nitrous oxide emissions from 18 anthropogenic and natural sources and 3 absorbent “sinks” of global nitrous oxide.
Absorbent “Sinks” of Nitrous Oxide
- Soils act as a significant sink for N₂O. Microbial processes in soils can consume and reduce N₂O emissions.
- Denitrifying bacteria convert N₂O to nitrogen gas (N₂) under anaerobic conditions, effectively removing it from the atmosphere. The balance between nitrification (which produces N₂O) and denitrification determines the net soil sink capacity.
Oceans
- Deeper and subsurface oceans absorb N₂O from the atmosphere, through dissolution at the air-sea interface. Marine phytoplankton and other organisms play a role in consuming dissolved N₂O.
Stratosphere
- In the stratosphere, N₂O reacts with ozone (O₃), leading to the formation of nitrogen oxides (NOx) and ultimately nitrogen gas (N₂).
- N2O stays in the atmosphere for longer than the average human lifespan (117 years), making it an effective sink for this greenhouse gas, impacting climate and ozone for a longer time.
Key Findings of the Study
- Alarming Rise in Nitrous Oxide (N2O) Emission: N2O emissions from human activities have increased by 40% (3 million metric tons of N2O per year) between 1980 and 2020.
- Top 5 Emitters of N2O were China (16.7%), India (10.9%), US (5.7%), Brazil (5.3%) and Russia (4.6%).
- Thus, India is the 2nd largest emitter of N2O globally after China.
- In Per-Capita terms, India has the lowest per capita emission of 0.8 kg N2O/person lower than China (1.3), US (1.7), Brazil (2.5) and Russia (3.3).
- The concentration of atmospheric N2O reached 336 parts per billion in 2022, a 25% rise over pre-industrial levels, more than what was estimated by the Intergovernmental Panel on Climate Change (IPCC).
- The study points out that currently, no technologies exist that can remove N2O from the atmosphere.
Sources of Nitrous Oxide Emissions
Natural Source
- Natural sources such as oceans, inland water bodies and soil contributed 11.8% of the global emissions of N2O between 2010 and 2019.
Human-Driven Source (Anthropogenic)
- Agricultural activities were responsible for 74% of human-driven nitrous oxide emissions.
- This was mainly due to the application of chemical fertilisers and the use of animal waste on croplands.
- The growing use of nitrogen fertilisers in the production of food worldwide is increasing concentrations of N2O.
- Other significant sources include industry, combustion, and waste treatment.
- The growing demand for meat and dairy products has also contributed to an increase in emissions through the increase in manure production, which also causes N2O emissions.
Rate/Growth of Emissions
- Emissions from agriculture continue to grow, while those from other sectors, such as fossil fuels and the chemical industry, are not growing or declining globally.
- Emissions from aquaculture are only a tenth of those from the use of chemical fertilisers on land but are growing rapidly, particularly in China.
- Emission Pattern in Regions: Among the 18 regions considered in this study, only Europe, Russia, Australasia, Japan and Korea had decreasing nitrous oxide emissions.
- Europe had the largest rate of decrease between 1980 and 2020, resulting from reduced fossil fuel and industry emissions.
- China and South Asia had the largest increases in N2O emissions from 1980 to 2020 at 92%.